Here is my lab for week 6.
This map projection assignment was extremely interesting to do and I actually thoroughly enjoyed it. Looking at different maps I always wondered where they came from and how the projection was set up. Obviously before this computer technology it was a lot more difficult, but now the accessability of these projections to the public is amazing. What I also thought back to was how this technology could be tied in with something like Google My Maps. Now map projections with pictures and labels of places doesn't seem so daunting and difficult, I would even enjoy making projections on my own and printing them since I enjoy maps so much.
First set of projections are the equal area maps which seem to conform to more traditional standards of what a map looks like to us. For the cylindrical projection, as you move further from the equator, the map gets distorted so area at the poles shows up very small. So this kind of projection would definitely be best if you wanted to focus on land or area near the equator. This is in slight contrast to the mollewide equal area projection, which tends to maintain a better area projection of the poles. This map projection is also in a curved form though, which makes for a very different view already. What is most interesting is that although these maps are both equal area, they show an estimated 2,200 mile difference between the distance between Washington D.C. and Kabul. So this map projection might not be best for that, because of the great variety.
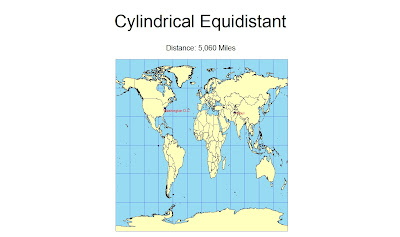
The next set of projections are the equidistant ones, with azimuthal equidistant being first. This projection I selected also is centered on the North Pole as opposed to the intersection of the Prime Meridian and Equator. As was said earlier in class, this kind of map projection would be ideal to measure distance from a center point to see range. Whether it be how far can your plane fly or how far a missile can be launched from a single point. The cylindrical equidistant too maintains equal distances between land masses, so this is very good at putting distance from two points in perspective. Yet despite their same projection, there is once again about a 2,000 mile difference for both maps between Washington D.C. and Kabul.
For the next set of projections, the conformal maps, they preserve angle between two points, but often at the cost of accuracy of size and shape of big land forms. Also, because the angle is maintained, the polar areas grow to be incredibly large and overblown in size compared to the rest of the world. The mercator conformal is ideal for navigation precisely because it maintains angles from one point to another and still can show an accurate representation of land near the equator. Stereographic conformal projection centered on the south pole, is probably the most interesting of all the projections I made. First, we hardly ever view the world from the southern pole and second, the areas of land masses become so distorted that only a section of the United States shown is larger than the entire southern hemisphere. Also the distance between Washington D.C. and Kabul is most altered, measuring at just over 30,000 miles between the two, which is most definitely not the most direct route. Once again though, a really intriguing projection.


No comments:
Post a Comment